
Figure 7. Quantitative model of the synaptic vesicle protein life cycle.
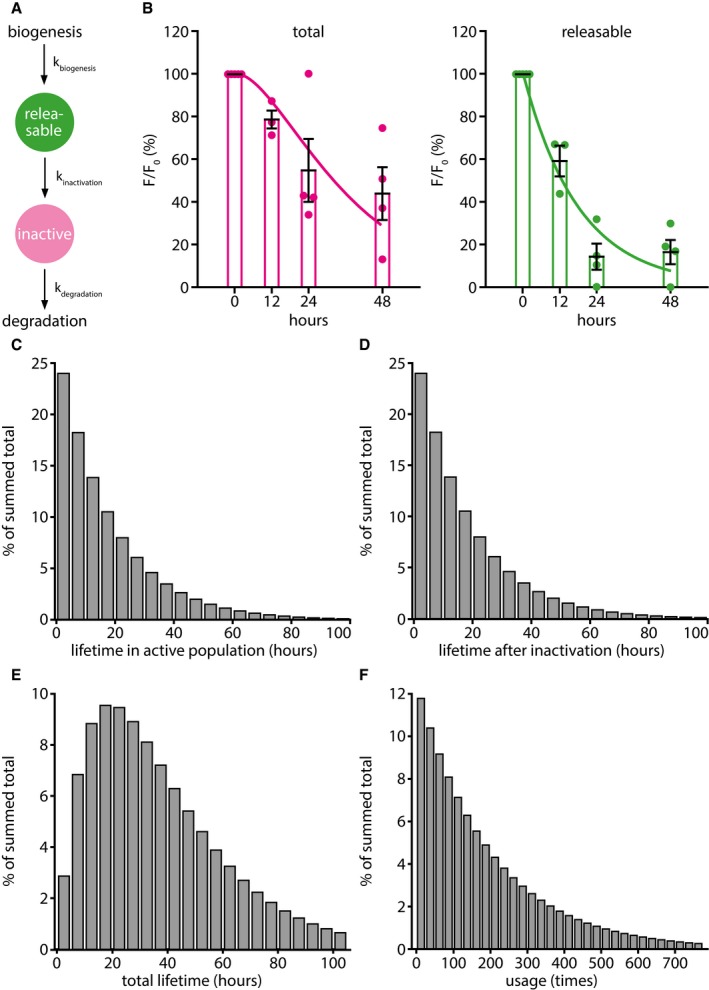
- The assumptions and parameters of the model. For simplicity, we refer on the graph to “synaptic vesicles”, although at the stages from exocytosis to endocytosis, while the vesicle proteins are present on the plasma membrane, this term should be replaced with “metastable synaptic vesicle protein assemblies”. As this aspect does not change the mathematical interpretation of the model, we decided to use the simpler terminology. The synaptic vesicle starts its life cycle after biogenesis as a releasable vesicle. During its activity, the synaptic vesicle has a certain chance to become inactivated. Afterward, the vesicle can be sent for degradation, as it does not enter the recycling pool again.
- The predictions from the model (lines) are here overlaid with the actual experimental data (mean ± SEM, n = 5, 3, 4, and 4 independent experiments per respective time point, at least 10 neurons sampled per experiment; from Appendix Fig S12C), implying that this very simple model closely recapitulates the observed synaptic physiology.
- The lifetime distribution of synaptic vesicles in the releasable population, as predicted by the model.
- The lifetime distribution of synaptic vesicles in the inactive population, after leaving the releasable population, as predicted by the model.
- The total lifetime distribution of synaptic vesicles, as predicted by the model.
- The probability distribution of times a synaptic vesicle is used per lifetime; the average is ˜ 200 times.