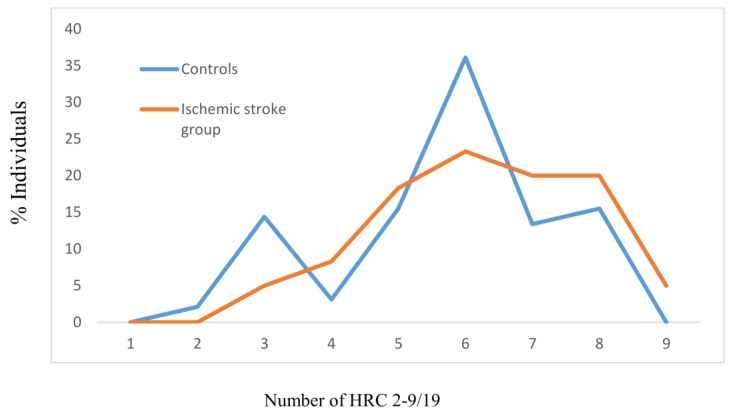
Figure 1.
Frequencies of homozygous recessive characteristics (HRC) in controls and manifested ischemic stroke patients. MV- mean value; SD- standard deviation; z- Mann Whitney U test; V- variability. Controls: N = 194, MV ± SD = 5.71 ± 1.61. Ischemic stroke group: N = 120, MV ± SD = 6.25 ± 1.54 (z = −2.496, p = 0.012; Cohen’s d = 34.28%). VControls = 28.20%, VIschemic stroke group = 24.64%.

