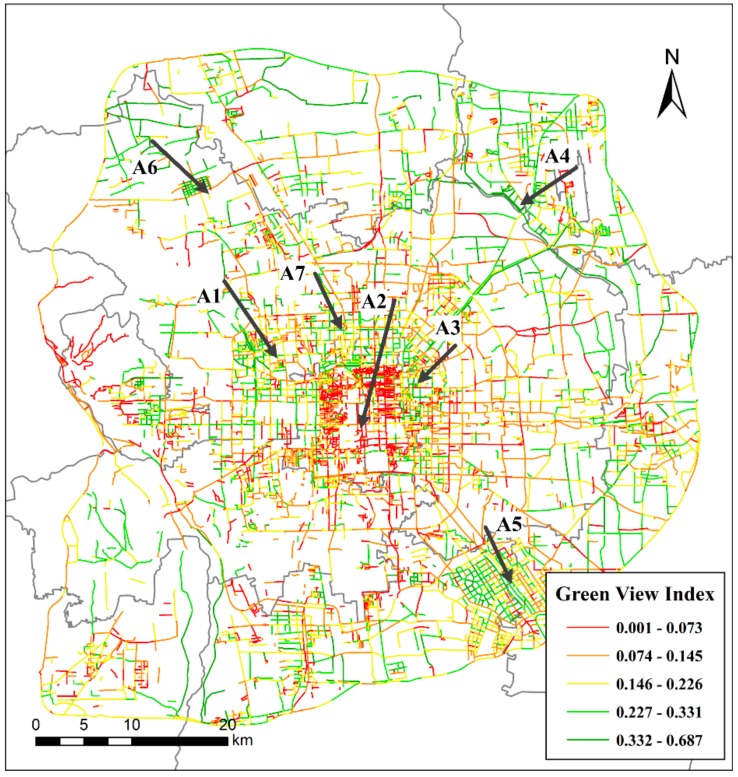
Figure 8.
The green view index (GVI) values at street level. The GVI values have been aggregated from site-level GVI values in Figure 7. This map shows the spatial distribution of GVI at street level. Markers A1–A7 were used to identify the concentration areas of very high or low GVI in the study area.

