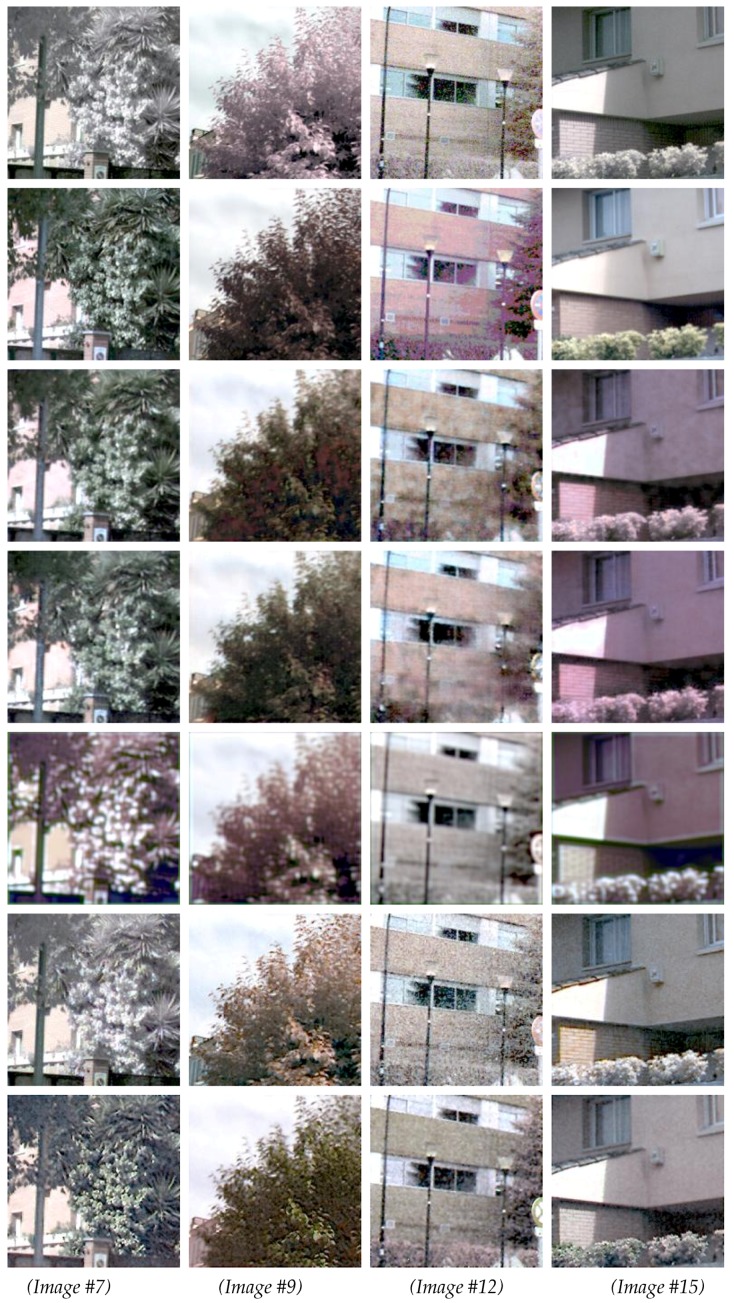
Figure 6.
Four samples from the average and worst results (see Table 2). (1st row) X images (RGB + N). (2nd row) Y (ground truth). (3rd row) Results from CDNet. (4th row) Results from ENDENet. (5th row) Results obtained with SRCNN ([30]). (6th row) Results obtained with ref. [21]. (7th row) Results obtained with ref. [20]. The image numbers correspond to the values presented in Table 2.

