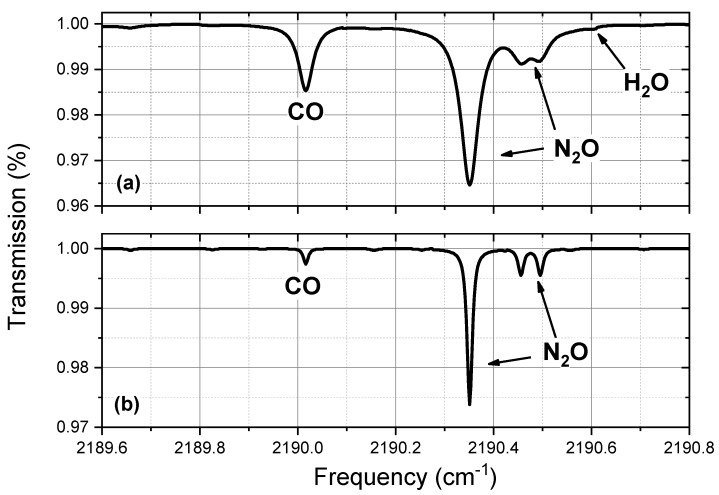
Figure 1.
HITRAN simulation of the spectral region around the selected CO line. (a) Simulation of the tropospheric spectrum at 300 mbar (about 10 km altitude). The CO mixing ratio is 100 ppbV, the NO mixing ratio is 325 ppbV and we overestimated the water vapour mixing ratio to 1000 ppmV. (b) Simulation of the stratospheric spectrum at 80 mbar (about 20 km altitude). The CO mixing ratio is 20 ppbV, the NO mixing ratio is 260 ppbV and the water vapour (not visible) mixing ratio is 10 ppmV.

