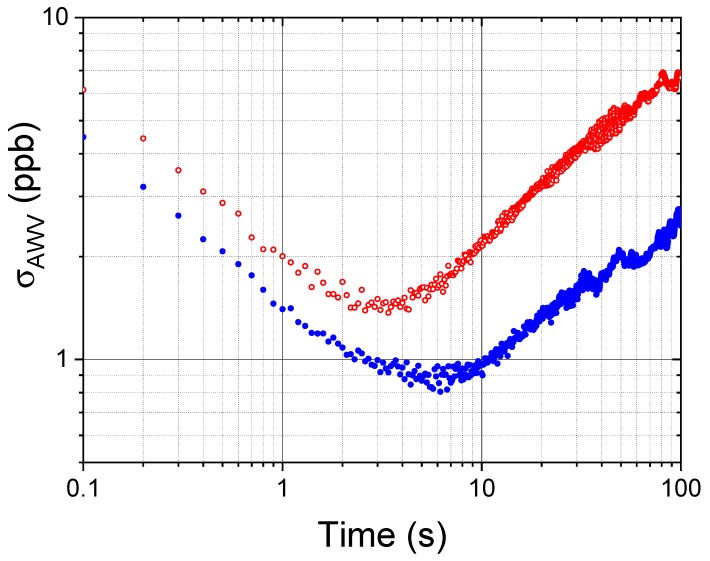
Figure 8.
Allan-Werle Variance () plot of the CO mixing ratio as a function of the integration time, for 30 min measurement of a CO mixture (mixing ratio 125 ppbV) at a rate of 10 Hz, at a temperature of 295 K and for two different pressures: 980 mbar (red open circles) and 50 mbar (blue closed circles)

