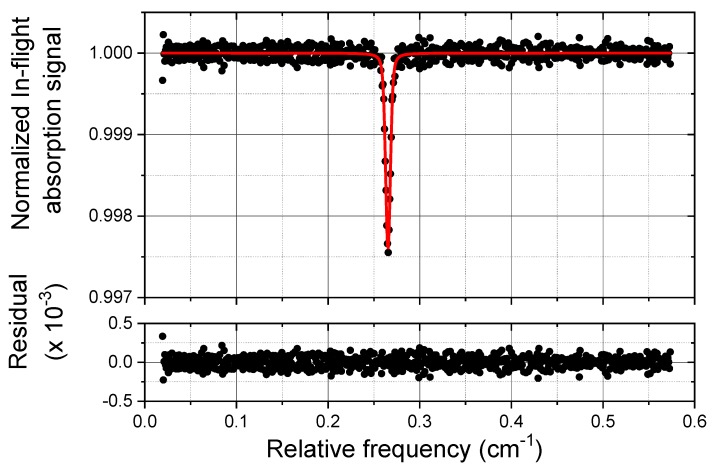
Figure 9.
Example of a typical in-flight CO (36 ± 1 ppbV) normalized absorption spectrum (scatter) and Voigt fit results (red line). The residual of the fitting procedure is shown in the bottom graph. The acquisition time is 1 s. The measurement was carried out during the flight on the 29th July 2017 at an altitude of 19 km and at a temperature of 281.8 K.

