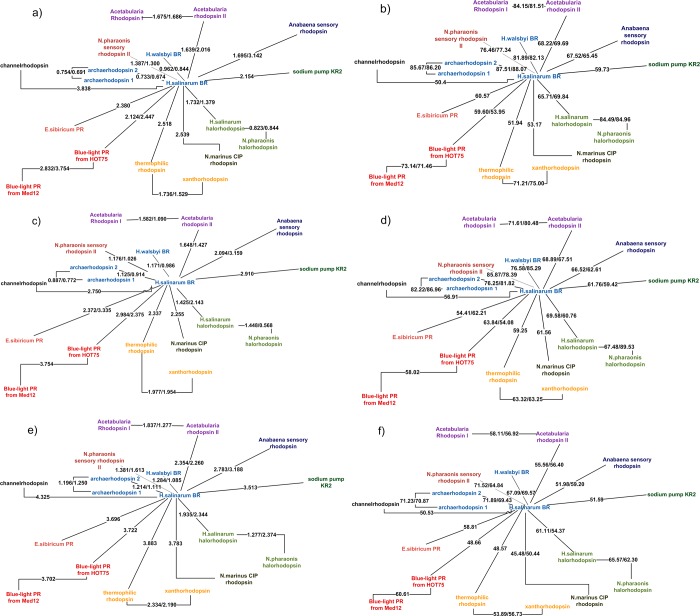
Figure 4.
Clustering pictures of the rhodopsins considered in the present work based on the quality of homology modeling predictions. For each pair of proteins, A and B, the three-dimensional model of A was predicted based on the crystallographic structure of B (AB value) and vice versa (BA value). The AB/BA values are given along each connecting line. For each prediction the average quality determines the reported distance between proteins. The different panels refer to different method/scoring combinations: (a) Medeller/Cα-RMSD; (b) Medeller/GDT-HA; (c) I-TASSER/Cα-RMSD; (d) I-TASSER/GDT-HA; (e) RosettaCM/Cα-RMSD; and (f) RosettaCM/GDT-HA. In all cases the AlignMe alignment results were provided.

