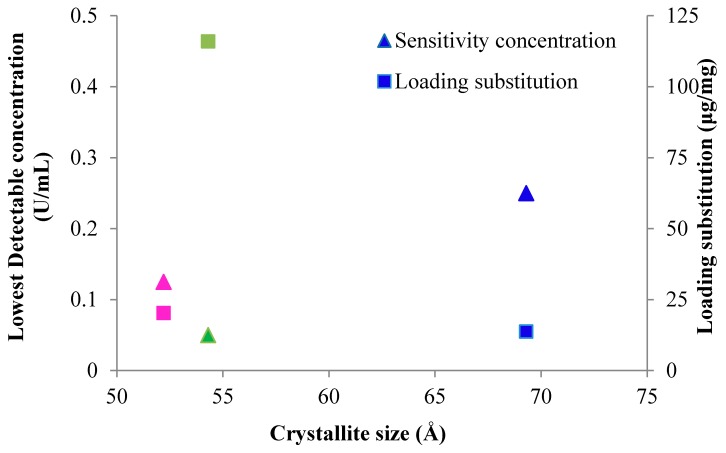
Figure 2.
Plot of sensitivity concentration and loading substitution versus the kinetics parameter X-ray diffraction parameter crystallite size. The sensitivity concentration is depicted as triangles and the loading substitution is shown as squares for CFP (blue), NA (pink), and NC (green). Lowest detectable concentrations were CFP (0.250 U/mL), NA (0.125 U/mL), NC (0.050 U/mL). Crystallite size are single point determinations based on X-ray Diffraction Analysis as previously reported [18]. Loading substitution were based on elemental analysis of nitrogen and measured CHN were within 0.40% and run twice to ensure reproducibility as previously reported [19].

