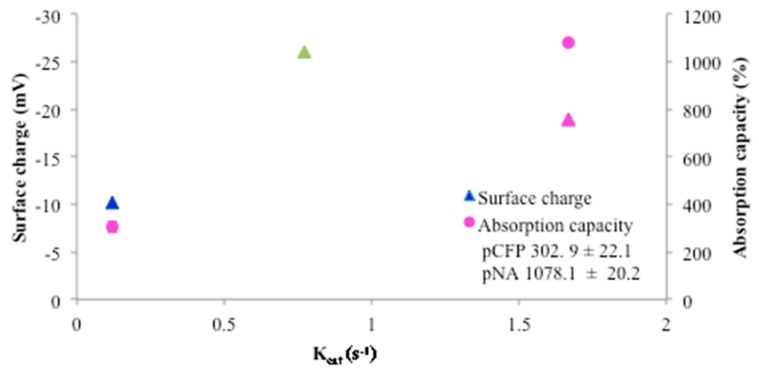
Figure 4.
Plot of surface charge and absorption capacity versus the kinetics parameter Kcat. The surface charge is depicted as triangles and the absorption capacity is shown as circles for CFP (blue), NA (pink), and NC (green). Note actual surface charge values are reported in Table 3. No absorption capacity was determined for NC due to nanocrystalline cellulose composition. kcat (s−1) values: NC (0.77), NA (1.67), CFP (0.12).

