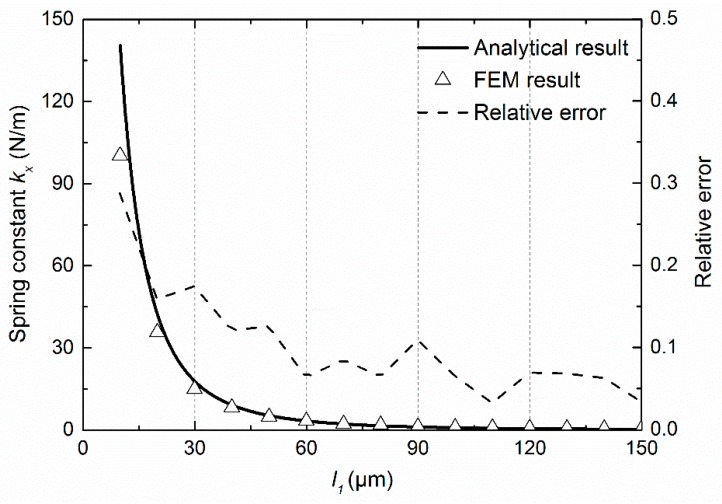
Figure 8.
Curves of spring constant along the x-axis as a function of l1 by both analytical calculation and finite element modelling (FEM) simulation along with the relative error as a function of l1, which is defined by (kFEM − kanal)/kFEM. Solid lines represent the approximate analytical results, triangles represent FEM simulation results, and dashed lines represent the relative errors. Red, black, and blue denote w = t = 0.5, 1, and 2 μm, respectively.

