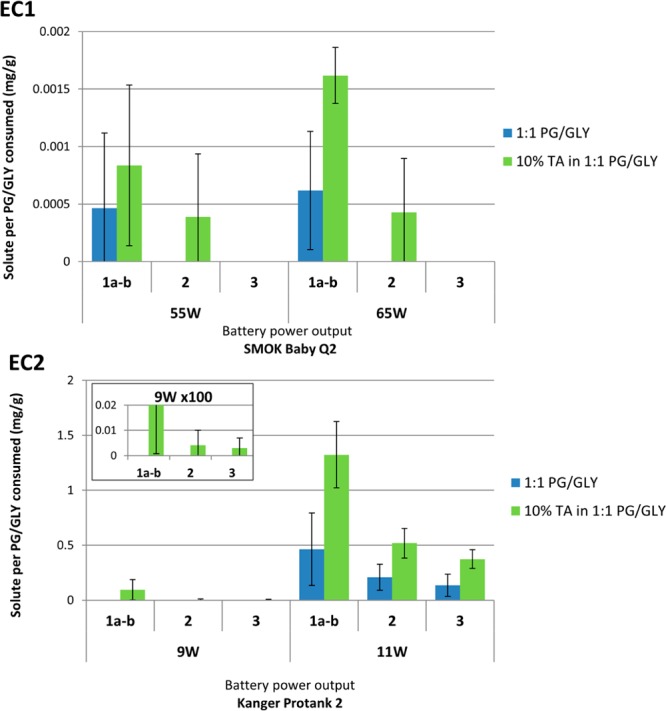
Figure 3.

Concentrations of compounds 1a–3 in the aerosolization of PG/GLY and increased levels with the addition of 10% TA. The blue bar represents the amount of product (mg solute/g solution consumed) formed from aerosolized PG/GLY e-liquid. The green bar represents the amount of products formed from aerosolized TA/PG/GLY e-liquid. The inset displays the results from EC2 at 9 W, expanded by 100 times. 1a, 1b, 2, and 3 represent PG formaldehyde hemiacetal, GLY formaldehyde hemiacetal, acrolein, and acetaldehyde, respectively. Errors bars were calculated by one standard deviation. The enhanced concentration of 1a–3 was significant under all conditions except in the case of 1a–b generated by EC1 at 55 W (see the Supporting Information).
