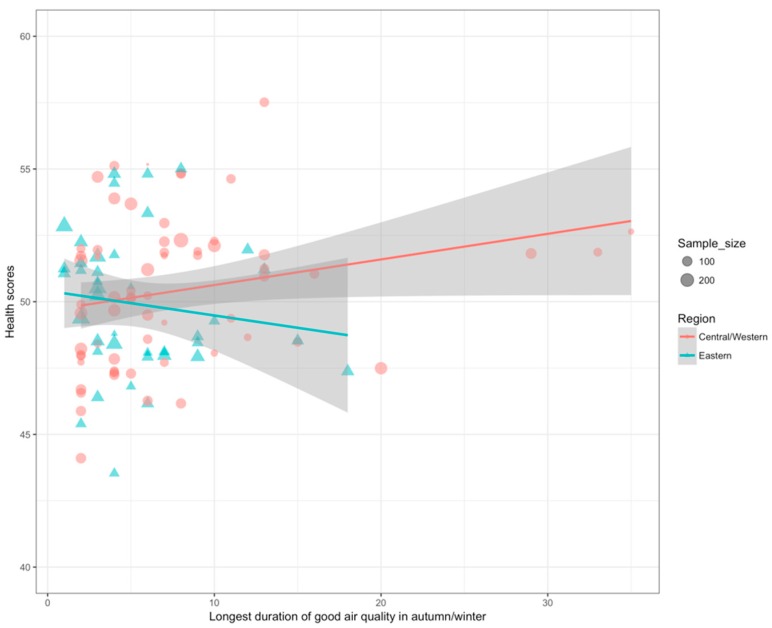
Figure 2.
Correlation between health scores and longest duration of good air quality in autumn/winter in Central/Western China, stratified by region. (Solid lines indicate the fitted linear regression, and the grey regions indicate 95% confidence intervals. The dots represent cities in Central/Western China, and the triangles represent cities in Eastern China. The sizes of the dots and triangles represent sample size).

