
Figure 2.
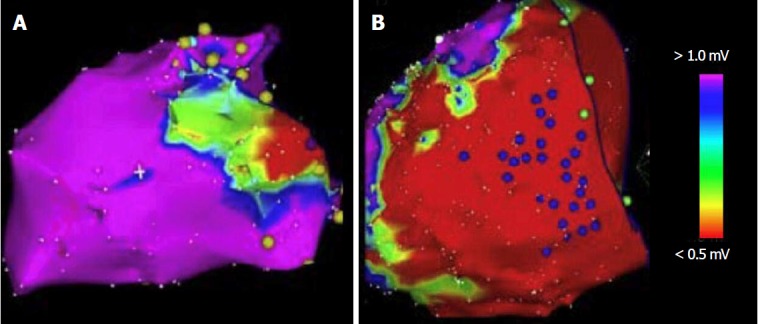
Endocardial and epicardial voltage mapping. A: The voltage map of the endocardium shows an area of scar. The map is color-coded to represent bipolar electro-gram voltage (red: Dense scar, 0.5 mV; purple: Normal tissue, 1.5 mV, intervening colors represent voltage values in between); B: The voltage map of the epicardium shows a larger area of scar.