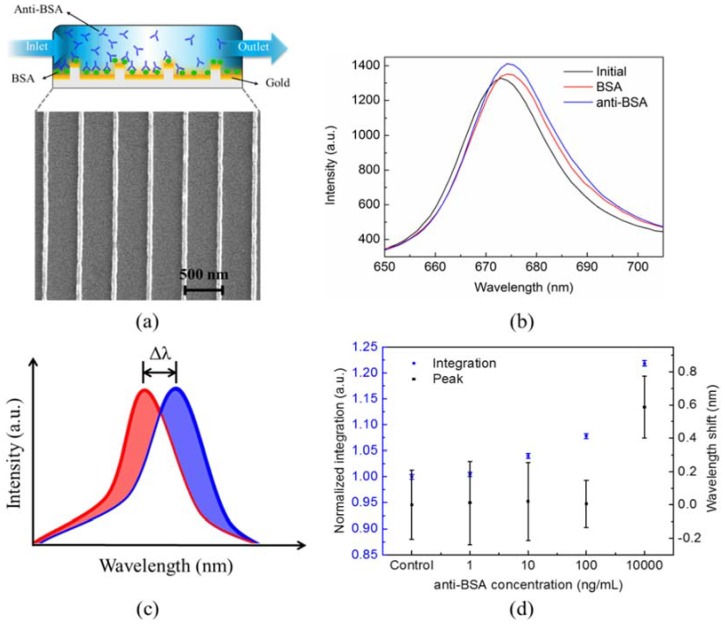
Figure 3.
(a) Bovine serum albumin (BSA) and anti-BSA were sequentially immobilized on the capped gold nanowire array. (b) Each pixel has its own spectral response. Transmission spectra of each pixel under different medium conditions were recorded for further analysis. (c) The illustration for peak-wavelength shift and spectral integration analysis for calculating the SPR responses during the protein–protein interactions. (d) The calculated peak-wavelength shift and spectral integration for BSA protein interacted with different concentrations of anti-BSA.

