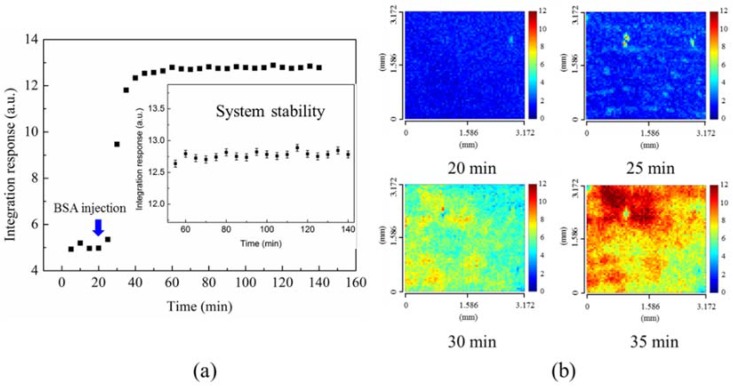
Figure 4.
(a) 1-mg/mL BSA solution was injected to the sensing area after 20 min. The time-lapse mean value was determined from the SPR scanning image. The STD was obtained from the measured results at different times. (b) BSA immobilization on the sensing surface at different times. The time-evolution 2D SPR images in the detection area showed the non-uniform distribution.

