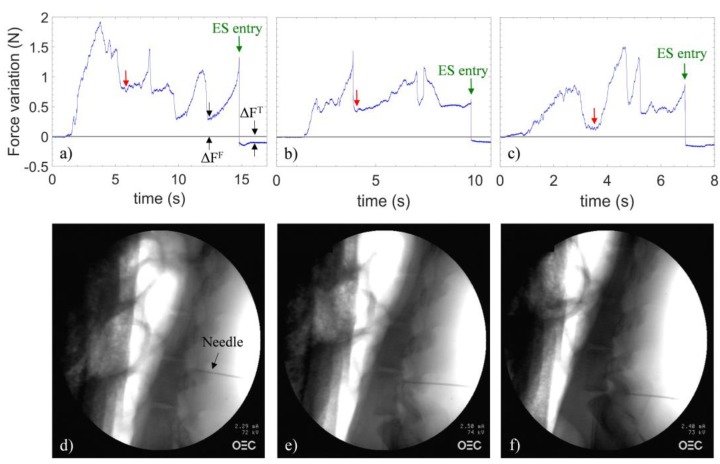
Figure 3.
Signals recorded during in vivo testing in (a) L5/L6, (b) L6/L7 and (c) L7/S1 spaces. The gray line is the baseline; discrimination parameters (ΔFT and ΔFF) are shown. X-ray images captured at the instant indicated by the green arrows in the figures pertaining to punctures in the spaces (d) L5/L6, (e) L6/L7 and (f) L7/S1.

