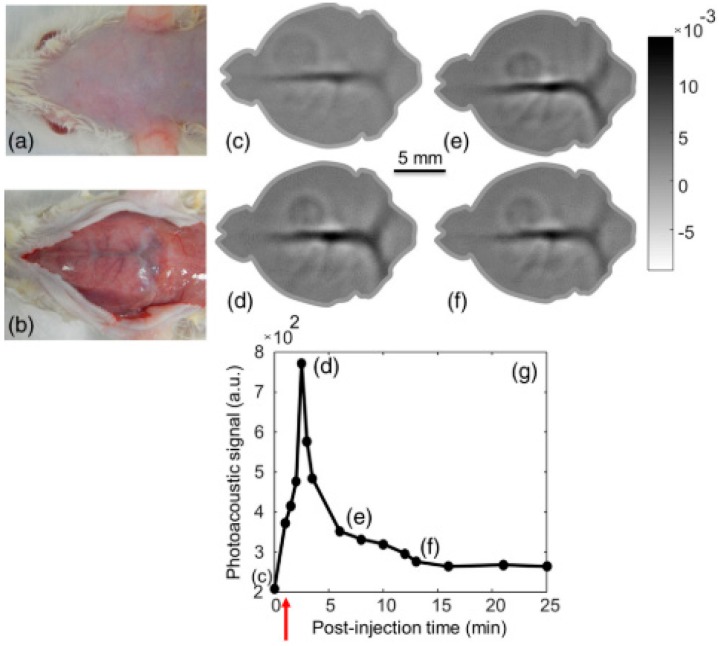
Figure 2.
In vivo PLD-PAT brain imaging and pharmacokinetics of ICG intravenously injected in to rat brain: Photograph of rat brain before (a) and after (b) removing the scalp. In vivo brain images at different scan times (c) 0 s, (d) 2 min, (e) 6 min, and (f) 13 min. (g) Graph shows the quantification of ICG signal in the superior SS during 25 min following injection. The red arrow indicates the ICG injection point. Reproduced with permission from Ref. [30].

