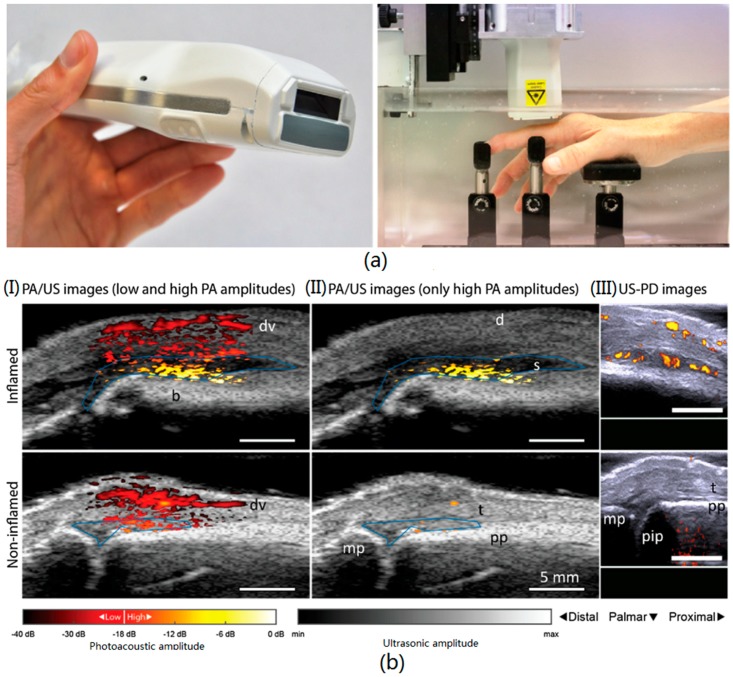
Figure 3.
The imaging setup (a) and PA/US and US/PD images of an inflamed (upper row) and non-inflamed contra-lateral joint (bottom row) of an RA patient (b). PA/US images in (I) show a difference in color between inflamed and non-inflamed, corresponding to an increase in amplitude levels. When discarding low PA amplitudes in (II), only features in the inflamed joint are visible. Corresponding US-PD images are shown in (III). The blue line in the PA/US images indicates the ROI used for quantification of PA features in the synovial space. The 0 dB level is the maximum PA amplitude from the inflamed joint. d = dermis; dv = dorsal vein; pp = proximal phalanx; pip = proximal interphalangeal joint; mp = middle phalanx; s = synovium; t = extensor tendon. Reproduced with permission from Ref. [31].

