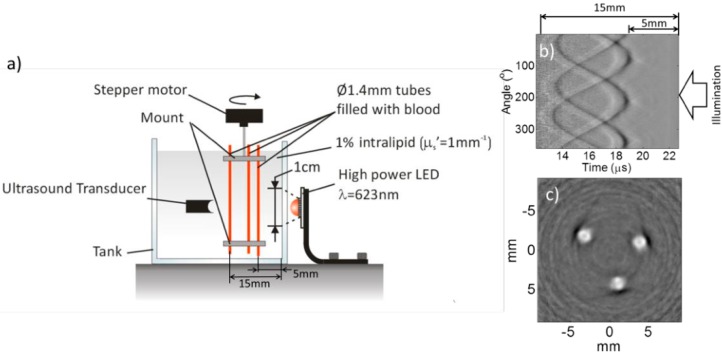
Figure 6.
(a) Photoacoustic imaging setup. (b) Time-resolved photoacoustic signals of three 1.4 mm tubes filled with human blood (35% haematocrit) and immersed in 1% Intralipid (μs′ = 1 mm−1), (c) reconstructed photoacoustic image. P = 9 µJ, N = 5000. Reproduced with permission from Ref. [27].

