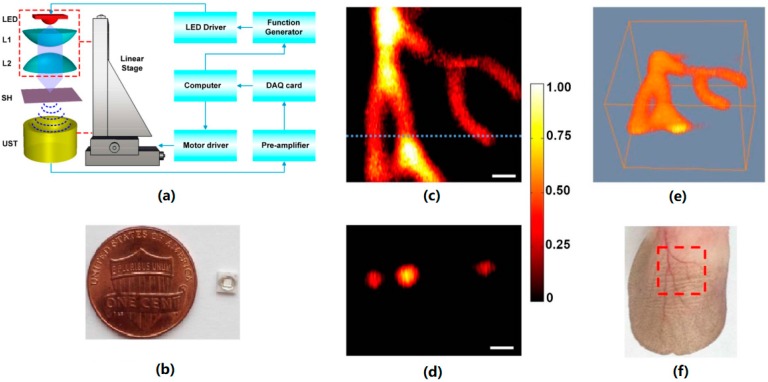
Figure 8.
In vivo photoacoustic imaging of mouse ear vasculature. (a) LED-PAM system. L1, L2. Lens; SH, sample holder; UST, ultrasound transducer. (b) Photograph of LED. (c) Maximum amplitude projection (MAP) image. (d) Cross-sectional imaging. (e) 3D volumetric image. (f) Photograph of mouse ear. All the scale bars indicate 0.5 mm in length. Reproduced with permission from Ref. [60].

