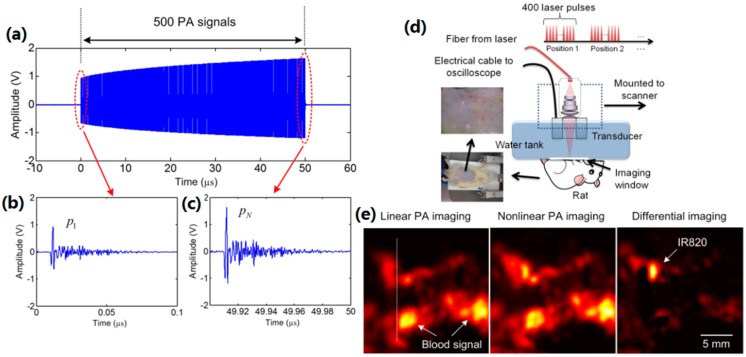
Figure 12.
(a) A typical 500 PA signal, (b) the first linear PA signal, and (c) the last nonlinear PA signal. (d) In vivo experimental setup based on the LDPA technique by quasi-CW laser excitation. (e) The reconstructed linear PA, nonlinear PA and differential imaging results of a rat with subcutaneous injection of IR820 in the abdomen. Strong PA signals from high-absorptive blood background are shown in the linear and nonlinear PA images. By subtracting, the signal from the IR820 pops up with linear background suppression. Reproduced with permission from Ref. [71].

