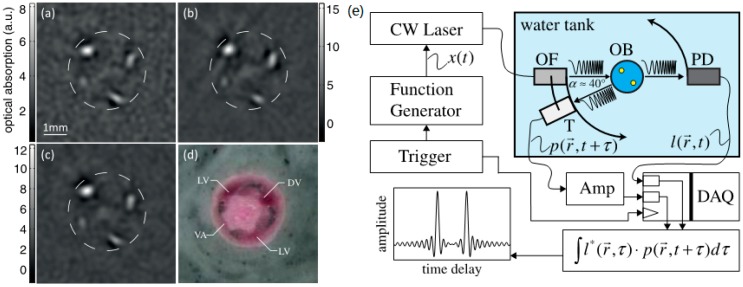
Figure 14.
(a) FD-optoacoustic tomography (FD-OAT) in vivo mouse tail image without ICG, (b) FD-OAT tail image during ICG injection, (c) tail image ~10 min after initial ICG injection, (d) cryoslice of the mouse (LV, lateral caudal veins; DV, dorsal caudal vein; VA, ventral caudal artery; dashed circle represents approximate tail surface), (e) schematic diagram of the frequency domain optoacoustic tomography system. An optical fiber (OF) guides the laser chirps onto the object (OB). Signals from the photodetector (PD) and the transducer (T) are acquired simultaneously by the data acquisition (DAQ) and afterwards are cross-correlated. Reproduced with permission from Ref. [90].

