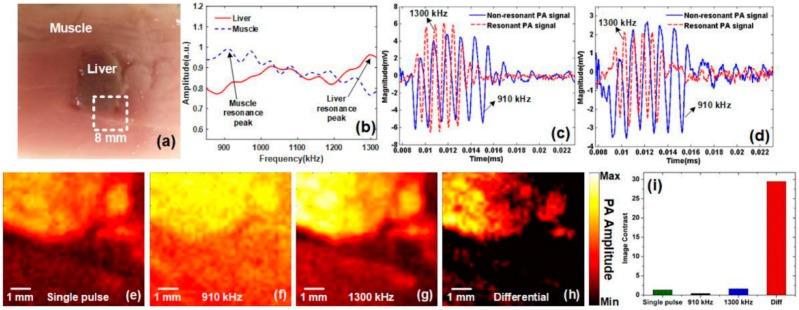
Figure 18.
(a) Photograph of porcine tissue. (b) The PA resonance spectra of porcine muscle (blue dashed) and liver (red solid). (c) PA waveforms of liver at resonance (1300 kHz, dashed red line) and off-resonance (910 kHz, solid blue line). (d) PA waveforms of muscle at resonance (910 kHz, solid blue line) and off-resonance (1300 kHz, dashed red line). (e) Conventional single-pulse-induced PA image (f) PARI at muscle resonance (910 kHz). (g) PARI at liver resonance (1300 kHz). (h) Differential image. (i) Contrast comparison of Figure 5e–h. Reproduced with permission from Ref. [99].

