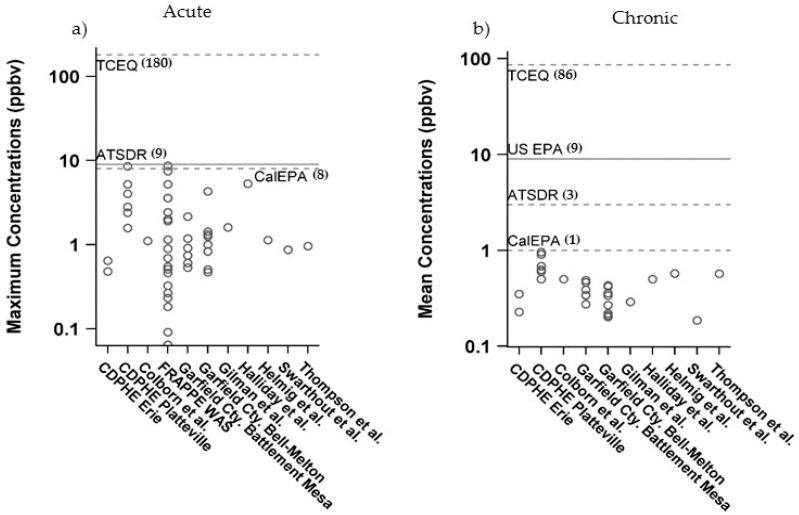
Figure 5.
Comparison of distribution of (a) maximums and (b) means of air concentrations of benzene across all air data sampling studies to various agency derived (a) acute and (b) chronic health guideline levels (HGVs). See Table 1 for details of each study. Solid line represents the value chosen for this assessment. Brackets indicate the agency derived HGV.

