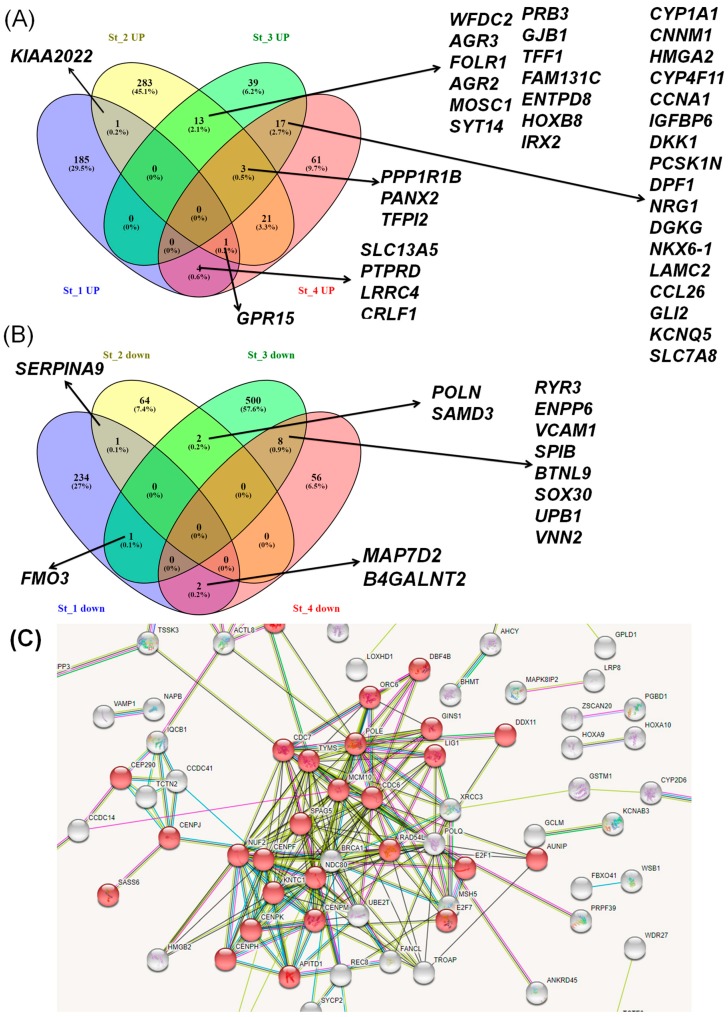
Figure 4.
Venn diagram overlapping the (A) overexpressed and (B) downregulated genes based on a specific analysis of current smokers versus never smokers with HNSCC stage 1, 2, 3, and 4; (C) String Network for the case of downregulated genes in current smokers versus never smokers in HNSCC stage 1, where the genes involved in cell cycle regulation are highlighted in red.

