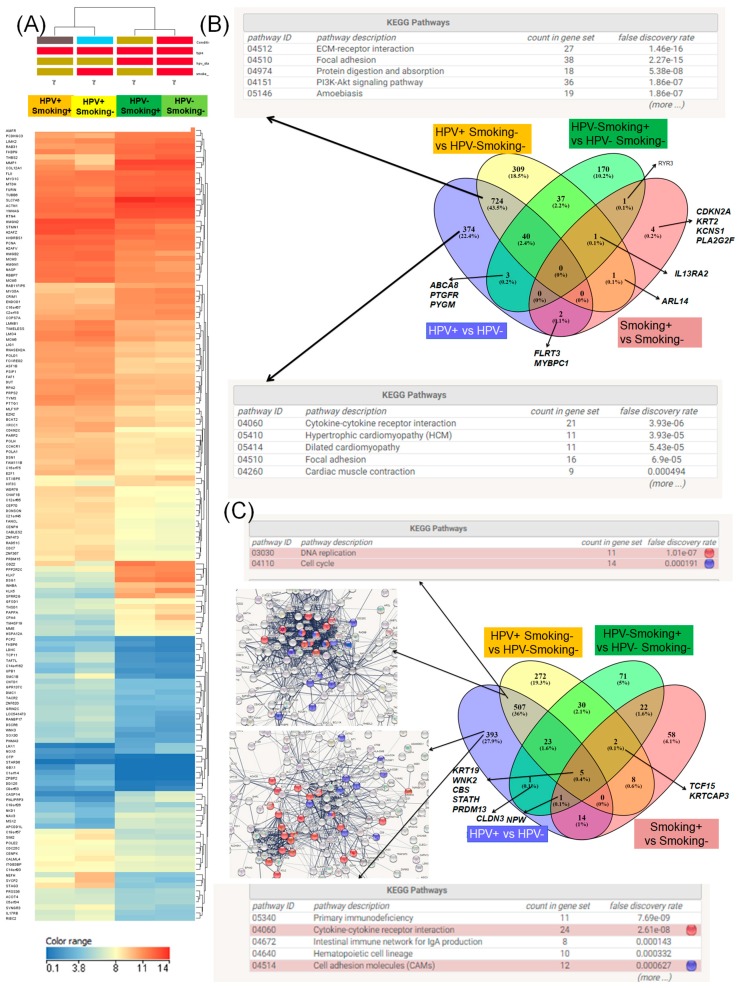
Figure 6.
Gene expression signature based on HPV16 status with/without correlation with smoking in HNSCC patients. (A) Heat maps representing the expression level in the HNSCC patient group based on smoking and HPV status. For nonsmoking and HPV16-negative patients (Smoking− HPV−, n = 32), we had Smoking+ HPV− (n = 11), Smoking+ HPV+ (n = 11), Smoking− HPV+ (n = 11), in dark blue being presented the downregulated genes and in red those overexpressed genes, generated using Gene Spring version 13.0. (B) Venn diagram showing the differential signature in the case of the overexpressed genes highlighting the main altered pathways as displayed by KEGG classification. (C) Venn diagram to emphasize that the differential signature in the case of the overexpressed genes underlines the main altered pathways as obtained from String Network and KEGG (Kyoto Encyclopedia of Genes and Genomes) classification, with red dots showing the genes involved in cytokine–cytokine receptor interaction and blue dots the cell adhesion molecules.

