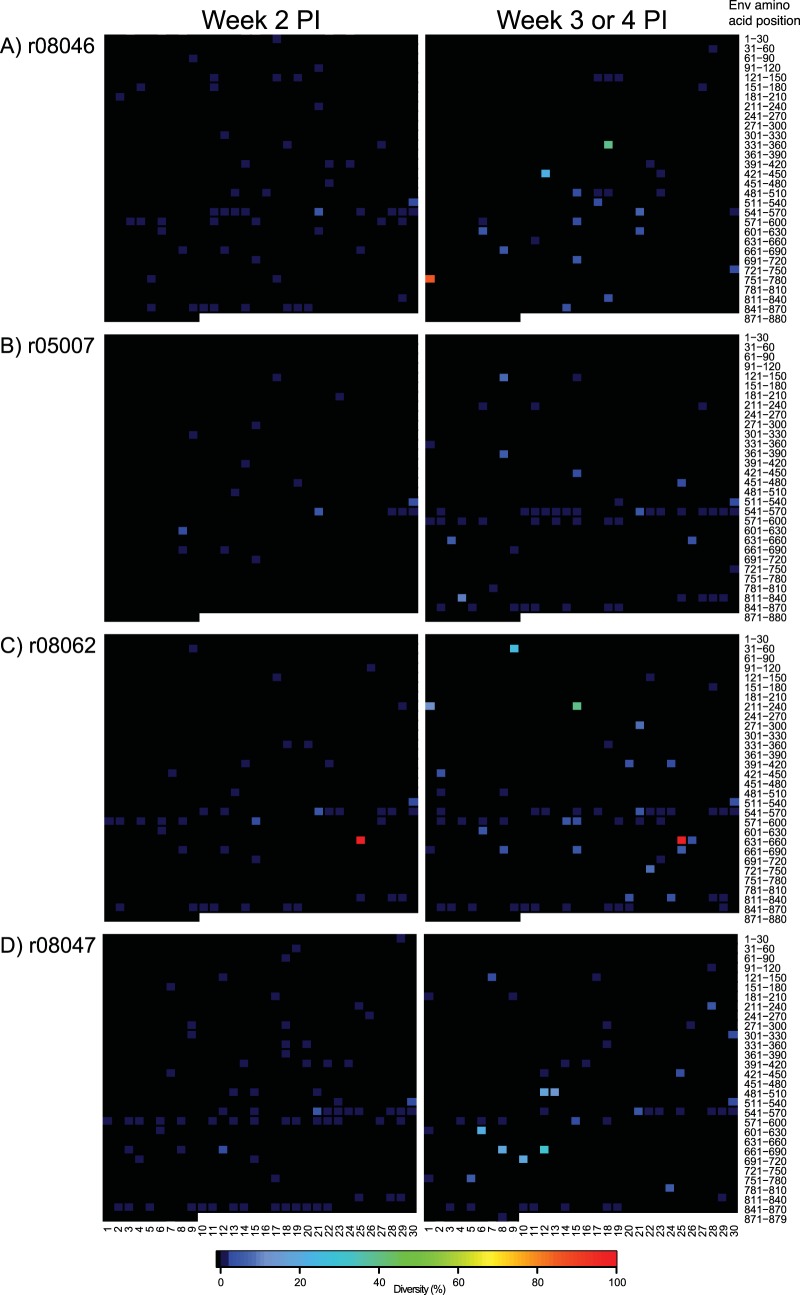
FIG 10.
env sequence diversity in acute-phase plasma from four group 2 controllers. Heat maps illustrate the levels of sequence diversity at each codon in the env open reading frame. The range of amino acids covered by each row is indicated on the right-hand side of the figure only as a reference because both synonymous and nonsynonymous mutations are considered in these heat maps. When applicable, the frequency and location of amino acid substitutions are described in the text and in Fig. 11. The codon corresponding to the first amino acid in Env is located in the top left corner of each grid. Each row spans 30 amino acids of the Env protein, except for the bottom row, which covers 9 amino acids and includes the last residue at position 879. The images on the left correspond to plasma samples collected at week 2 postinfection. The images on the right correspond to plasma samples collected at week 3 p.i., or week 4 p.i. in the case of r08046. Data from r08046, r05007, r08062, and r08047 are shown in panels A, B, C, and D, respectively.

