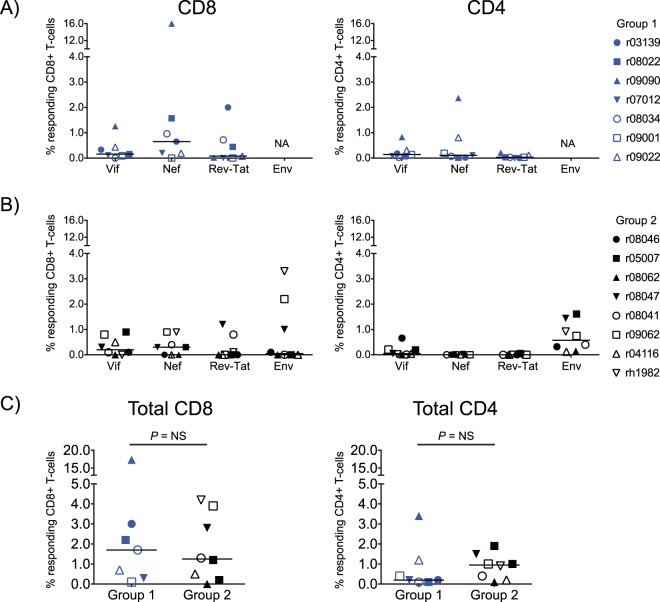
FIG 3.
Vaccine-induced SIV-specific CD4+ and CD8+ T-cell responses in groups 1 and 2 at the time of the first SIV challenge. CD8+ and CD4+ T-cell responses were measured in PBMC by ICS using pools of peptides (15-mers overlapping by 11 amino acids) spanning the appropriate SIVmac239 proteins. Peptides covering the Rev and Tat proteins were tested together. The percentages of responding CD4+ or CD8+ T cells displayed in all panels were calculated by adding the frequencies of positive responses producing any combination of three immunological functions (IFN-γ, TNF-α, and CD107a). The magnitude and specificity of vaccine-induced CD8+ (left panels) and CD4+ (right panels) T-cell responses are shown for group 1 (A) and group 2 (B). (C) Comparison of the total magnitude of vaccine-elicited SIV-specific CD8+ (left) and CD4+ (right) between groups 1 and 2. The Mann-Whitney U test was used for these comparisons, and no statistically significant difference was found. RMs in groups 1 and 2 are color-coded in blue and black, respectively, and each symbol corresponds to one vaccinee. Lines represent medians. NA, not applicable; NS, not significant.

