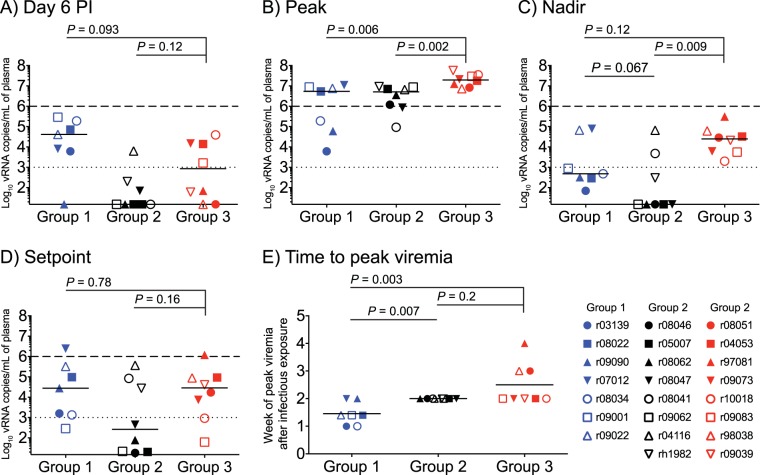
FIG 7.
SIV plasma viral load comparisons among groups 1, 2, and 3. (A) Plasma VLs measured on day 6 postinfection (p.i.). (B) Peak VLs. (C) Nadir VLs. (D) Setpoint VLs, calculated as the geometric mean of VLs measured between week 8 p.i. and the last chronic phase time point available. (E) Time to peak viremia, determined as the week p.i. when each animal experienced its peak VL. The dotted lines in panels A to D are for reference only and indicate a VL of 103 vRNA copies/ml. The dashed lines in panels A to D are also for reference only and denote a VL of 106 vRNA copies/ml. Lines represent medians and P values were calculated using the Mann-Whitney U test. Groups 1, 2, and 3 are color-coded in blue, black, and red, respectively, and each symbol corresponds to one vaccinee.

