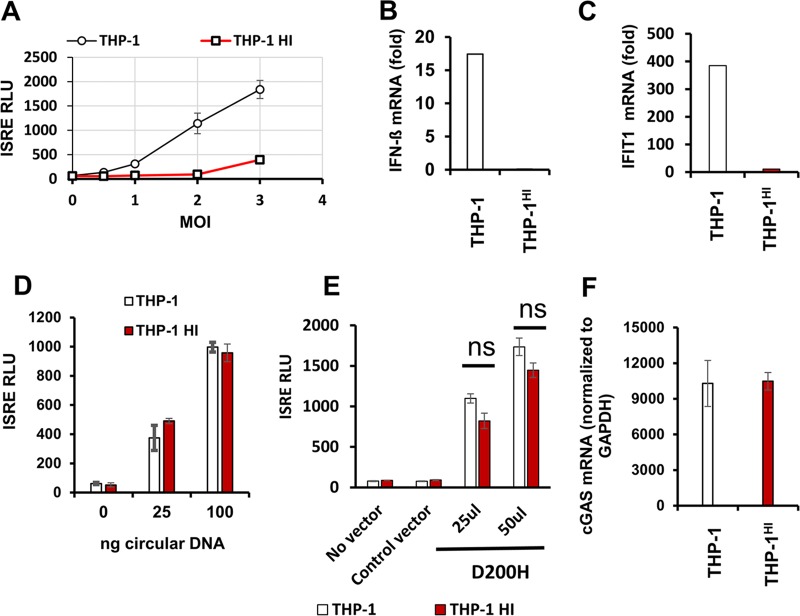
FIG 3.
Cellular levels of TREX1 determine interferon-stimulated gene (ISG) induction by HIV-1. THP-1 and THP-1HI cells were infected with HIV-1luc or HIV-1GFP at a range of MOIs and assayed for ISG induction by ISRE activity or qRT-PCR. (A) ISRE activity in THP-1 and THP-1HI cells infected with HIV-1luc at 48 hpi. (B and C) Interferon beta mRNA and IFIT1 mRNA levels were quantified by qRT-PCR and normalized to the level of GAPDH at 24 hpi in the indicated cells. (B) Interferon beta mRNA induction (MOI of 2). (C) IFIT1 mRNA induction (MOI of 2). (D) THP-1 and THP-1HI cells were transfected with indicated doses (in nanograms) of circular plasmid DNA, and cells were assayed for ISRE luciferase activity at 24 h posttransfection. (E) THP-1 cells and THP-1HI cells were transduced with the indicated amounts of catalytic mutant D200H TREX1-encoding lentiviral vector or an empty vector and selected with puromycin. Stably transduced cells were assayed for ISRE luciferase activity. (F) cGAS mRNA levels were measured by qRT-PCR and normalized to the level of GAPDH in THP-1 cells and THP-1HI cells. The data presented in panel A are representative of over 10 experiments, with error bars representing standard deviations of triplicate measurements. Data presented in all other panels in this figure are from one representative experiment of three experiments, with error bars representing standard deviations of triplicate measurements. ns, not significant.

