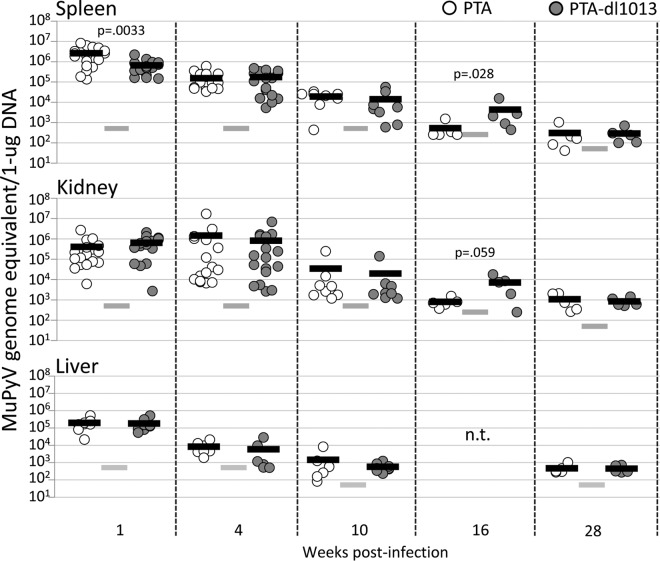
FIG 2.
Quantitation of PTA and PTA-dl1013 during the acute and persistent phases of infection. Adult C57BL/6 female mice were inoculated with 1 × 10⁵ IU of either PTA (white circles) or PTA-dl1013 (gray circles) via i.p. injection, and genome levels in spleen, kidney, and liver were quantified at different times postinfection by using a TaqMan probe and primers that recognize both genomes. The limit of detection for the qPCRs was 10 copies. The input DNA amounts were 20 ng (at 1, 4, and 10 weeks p.i.), 40 ng (at 16 weeks), or 200 ng (at 28 weeks). Genome copy numbers were normalized per 1 μg. Circles represent individual animals. The black bars represent the average genome copy number. The gray bars represent the limit of detection (LOD) of the assay after normalization. Samples that were below the limit of detection are graphed at the limit of detection. P values were calculated using the Mann-Whitney U test. n.t., not tested.

