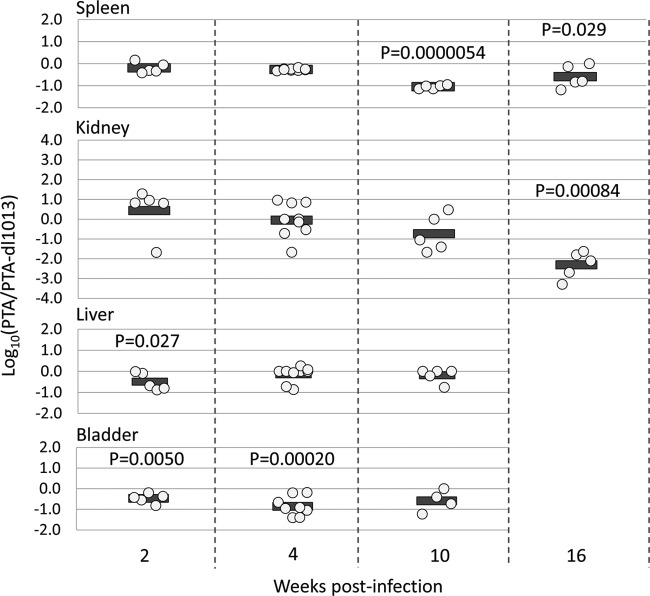
FIG 4.
Ratio of PTA and PTA-dl1013 in tissues of coinfected mice. The ratios of PTA and PTA-dl1013 genome copies from Fig. 3 in the indicated organs of individual mice coinfected with PTA and PTA-dl1013 are shown. Values below the limit of detection were set at the limit of detection. The circles represent log10(PTA/PTA-dl1013). P values were calculated using one-sample t test.

