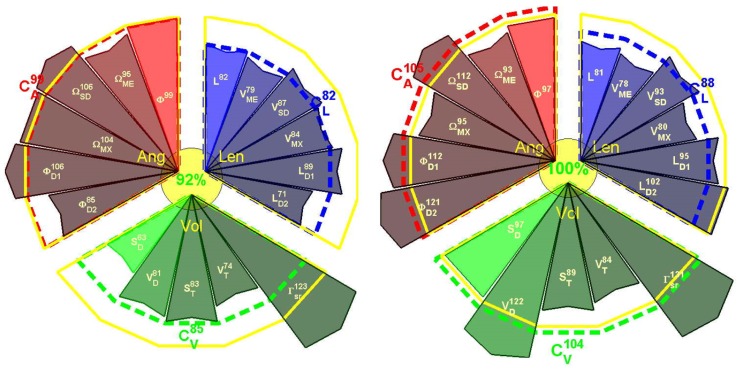
Figure 3.
Example of scoring visualization for Right and Left upper limbs from selected motion scoring for one trial of a stroke patient. The scoring was obtained from the 17 parameters defined above. Parameters are grouped by angular (Ang, in red), length (Len, in blue), and volumetric (Vol, in green) properties. Yellow contour corresponds to 100% (healthy group comparison). Parameter sign values are explained in Table 2. Scores for each group and total scores are depicted near the sector of the group and in the center, respectively.

