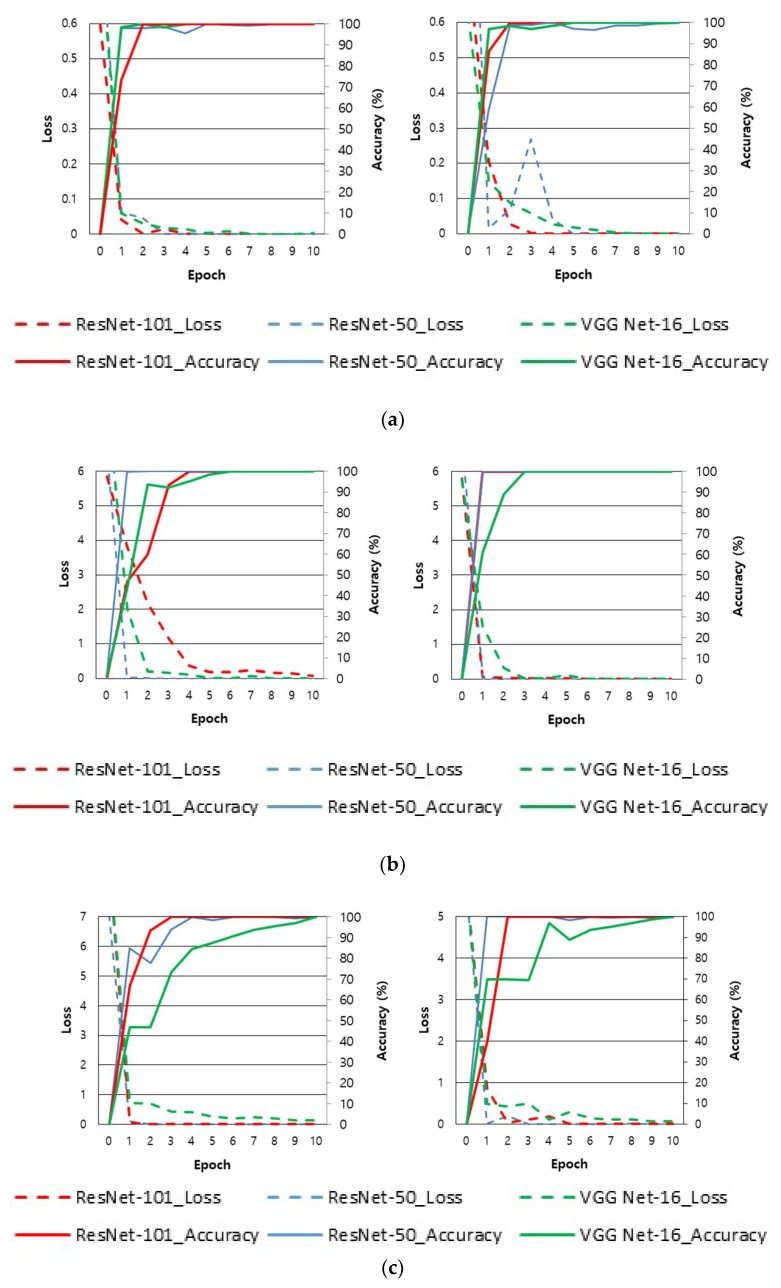
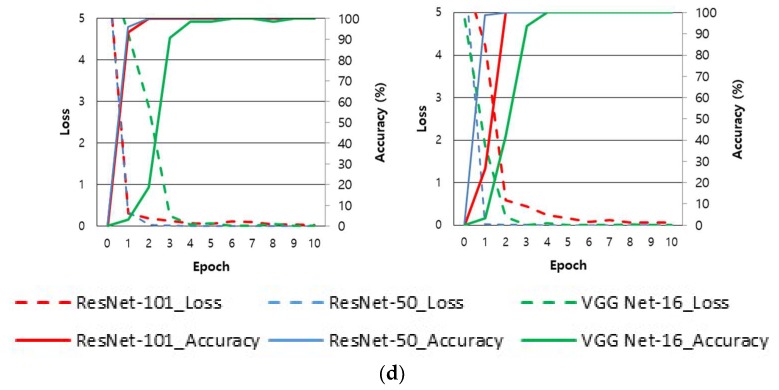
Figure 8.
Examples of loss and accuracy curves with training data of two-fold cross validation according to databases. Using (a) finger-vein images in SDU-DB database, (b) finger shape images in SDU-DB database, (c) finger-vein images in PolyU-DB database, and (d) finger shape images in PolyU-DB database. In (a)–(d), the left and right figures show the results of the first and second cross validation, respectively.


