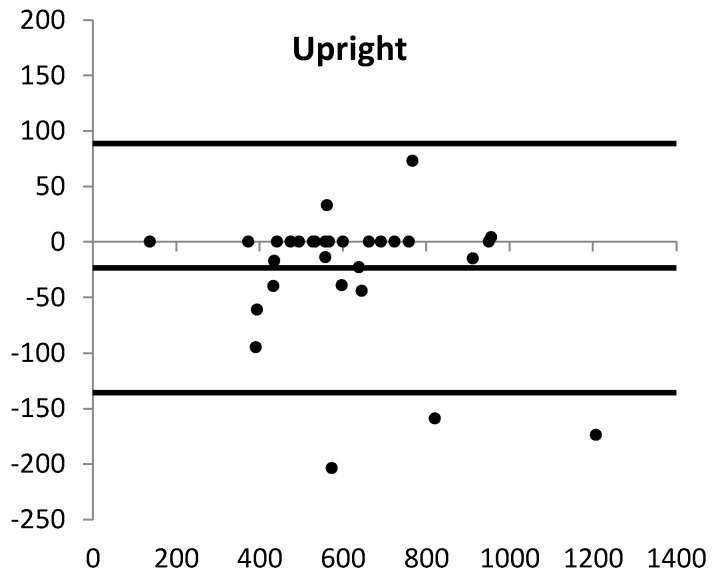
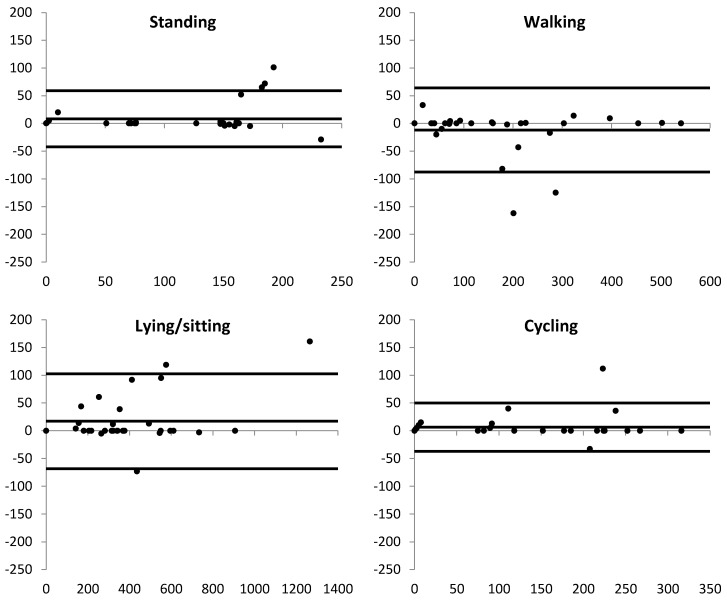
Figure 2.
The Bland–Altman plots (x-axis: mean of Activ8 and video recording; y-axis: difference, calculated as Activ8 minus video recording) of the body postures and movements for all data together. The solid lines are the mean difference and the upper and lower limits of agreement. For “standing” and “walking/running”, only data from the basic activities (performed in the laboratory or at home) were used. Each dot is one assessment.


