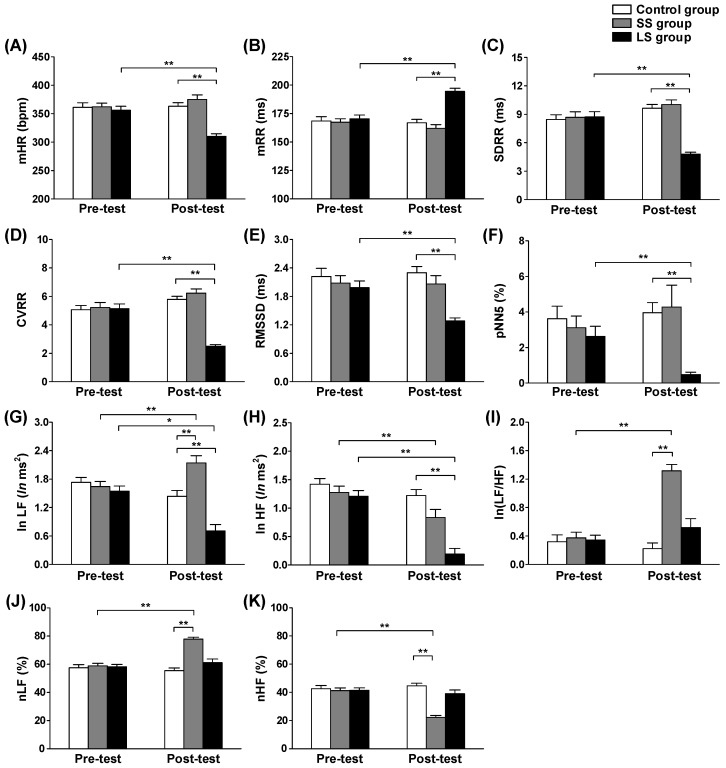
Figure 5.
Effects of short- and long-term stress on (A–F) HRV time domain features and (G–K) frequency domain features. The LS group had significantly lower values across all HRV time domain features when compared with the control group and their pre-test. The SS group had significantly higher log-transformed low frequency power (ln LF), normalized low frequency (nLF), and log-transformed ratio of low frequency and high frequency powers (ln (LF/HF)) values and a significantly lower normalized high frequency (nHF) value when compared with the control group and their pre-test. (One-way analysis of variance followed by Tukey’s post-hoc test; * p < 0.01 and ** p < 0.001).

