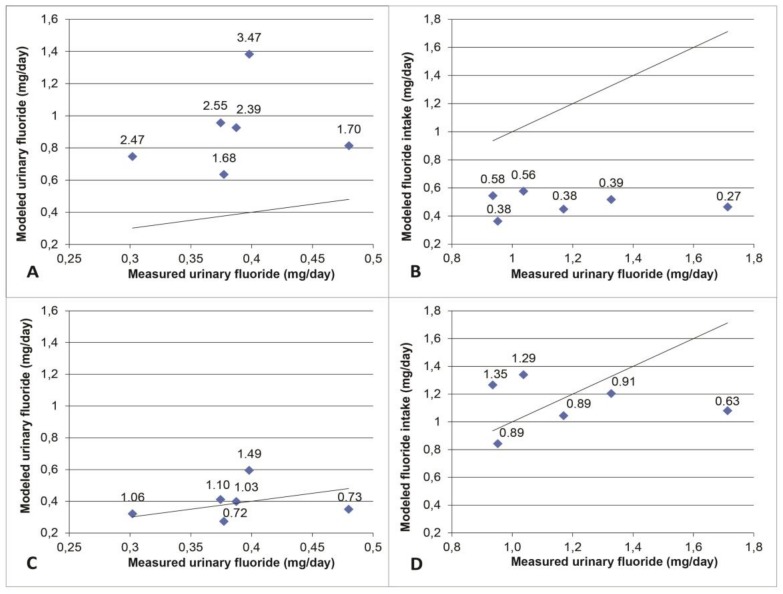
Figure 4.
Results of model simulation of exposure data in the literature as a function of experimental biological measures in children aged 4 to 7 years. Each point represents a study while the line represents a perfect agreement. The values at the top of the points represent the ratios between the modeled values and the experimental values. Panels (A,B) illustrate, respectively, the over-estimation and underestimation of the modeled values. Panels (C,D) show the predicted values around the perfect agreement line when adjusted by multiplying by the adjustment factor of 0.43 in (C) and 1/0.43 in (D).

