
Figure 2.
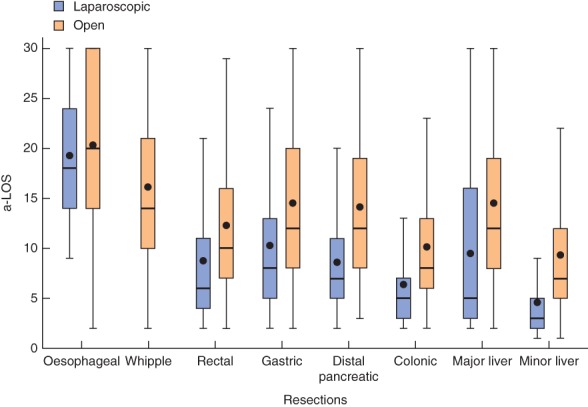
Box and whisker plot of aggregated length of hospital stay (a‐LOS) for eight resection groups. Bars within boxes show median values (quartile (Q) 2); boxes show interquartile ranges (Q3–Q1); black dots indicate mean values; upper whiskers denote Q3 + (i.q.r. × 1·5); lower whiskers denote the lowermost value within Q1 − (i.q.r. × 1·5). Stays are truncated at 30 days and hence means are skewed. For simplicity, converted cases are included in the open‐access group