Figure 1.
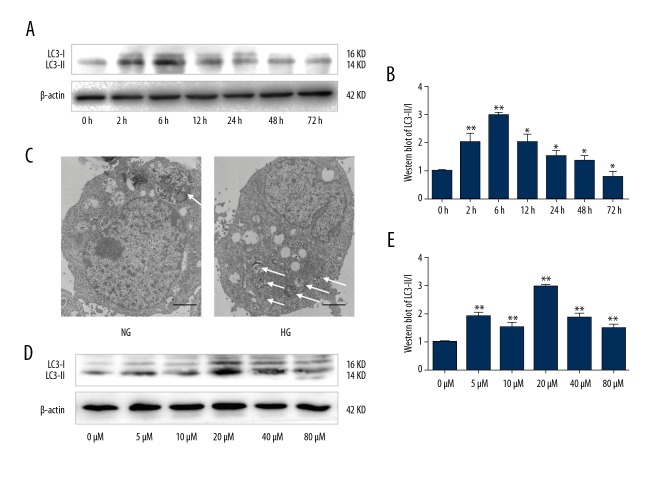
High glucose induced LC3-II expression and autophagy in podocytes (A) Western blot. Podocytes were cultured in HG (30 mM) or NG (5.5 mM) for various periods of time (0, 2, 6, 12, 24, 48, and 72 h) and subjected to Western blot analysis of LC3-II expression. (B) Quantified data of A. Values are presented as mean ±SD from 3 independent experiments. * P<0.05 and ** P<0.01 vs. control (0 h). (C) Transmission electron microscopy. Podocytes were cultured in HG (30 mM) or NG (5.5 mM) for 6 h and subjected to transmission electron microscopy. Magnification, ×5000. (D) Western blot. Podocytes were cultured in Genistein at various concentrations (0, 5, 10, 20, 40 and 80 μM) and subjected to Western blot analysis of LC3-II expression. (E) Quantified data of D. The values are expressed as mean ±SD of 3 independent experiments. ** P<0.01 vs control (0).

