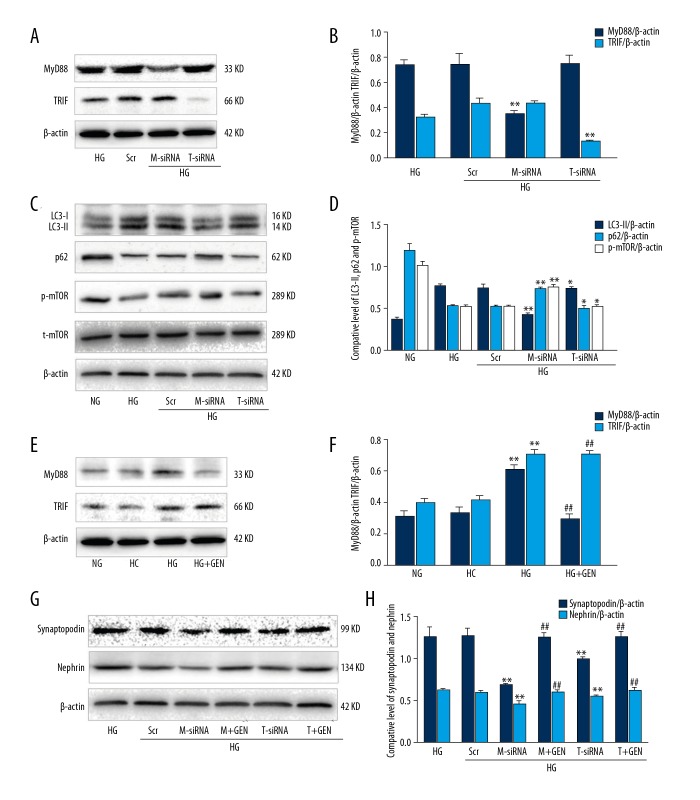
Figure 4.
MyD88 and TRIF triggered autophagy in high glucose-induced podocytes. (A) Western blot. Podocytes were incubated with HG (30 mM), HG plus negative control siRNA (Scr), HG plus MyD88 siRNA (M-siRNA), or HG plus TRIF siRNA (T-siRNA) and then subjected to Western blot analysis. (B) Quantified data of A. (C) Podocytes were incubated with HG (30 mM), HG plus negative control siRNA (Scr), HG plus MyD88 siRNA (M-siRNA), HG plus MyD88 siRNA and GEN (M+GEN), HG plus TRIF siRNA (T-siRNA), or HG plus TRIF siRNA and GEN (T+GEN) and then subjected to Western blot. (D) Quantified data of C. Values are expressed as mean ±SD of 3 independent experiments. * P>0.05 and ** P<0.05 vs. HG. (E) Western blot. Podocytes were incubated with NG (5.5 mM), HC (5.5 mM glucose +24.5 mM mannitol), and HG plus genistein (30 mM HG +20 μM genistein, HG+GEN) for 6 h and then subjected to Western blot analysis. (F) Quantified data of E. ** P<0.05 vs. NG; # P>0.05 and ## P<0.05 vs. HG. (G) Podocytes were incubated with HG (30 mM), HG plus negative control siRNA (Scr), HG plus MyD88 siRNA (M-siRNA), HG plus MyD88 siRNA and GEN (M+GEN), HG plus TRIF siRNA (T-siRNA), or HG plus TRIF siRNA and GEN (T+GEN) and then subjected to Western blot analysis. (H) Quantified data of G. Values are expressed as mean ±SD of 3 independent experiments. * P>0.05 and ** P<0.05 vs. HG; ## P<0.05 vs. M-siRNA or T-siRNA.

