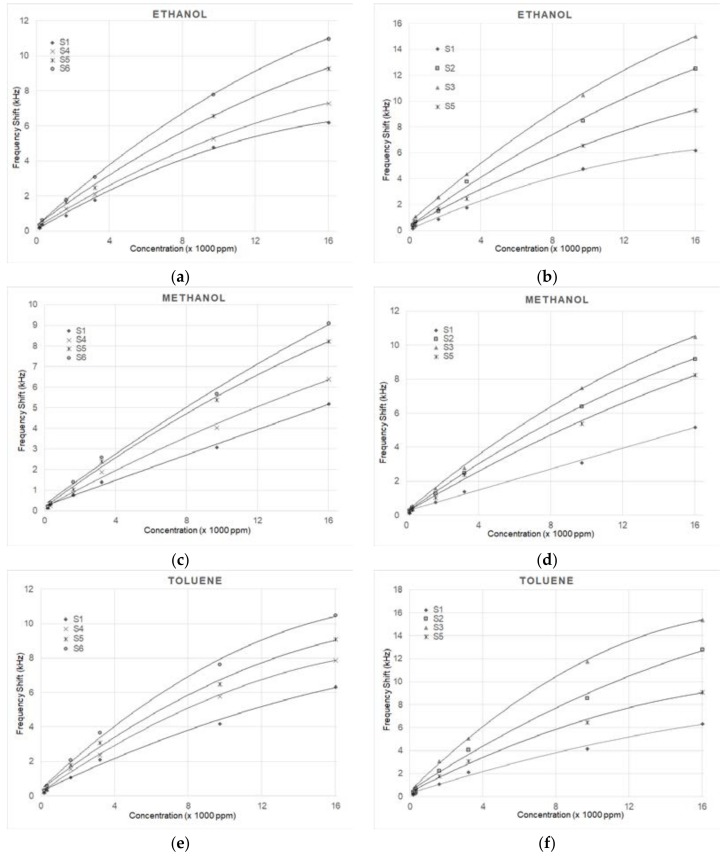
Figure 5.
Frequency shift of the sensors for different concentrations of ethanol, methanol and toluene VOCs. (a,c,e) compare sensors all having 50 nm NPs and different NP concentrations, and sensor S1 with no NPs. (b,d,f) compare sensors with the same NP concentration of 0.4 mg/mL and different NP diameters, and sensor S1 with no NPs. See Table 1 for sensor identification.

