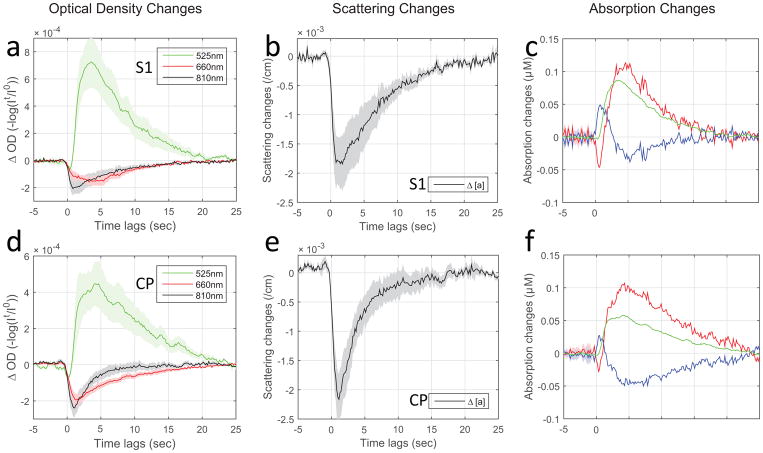
Fig. 2.
Optical intrinsic signals of scattering vs. absorption in response to neuronal activation. The optical responses to local field potentials for different wavelengths, 810nm/525nm/660nm, are estimated respectively by least-squares fitting of simultaneous LFP/IOS recording data sets. The group results expressed as tissue optical density are plotted in first column (a and d, mean+/−SEM: S1, n=7 rats; CP, n=6 rats). Using the modified Beer-Lambert law and considering both tissue absorption and scattering changes that occur in response to neural activity, the concentration changes in HbO2, Hb (tHb=HbO2+Hb) and scattering per centimeter were calculated and plotted in mean+/−SEM (scattering: b and e; absorption: c and f from S1 and CP respectively). The results from the S1 group are shown in the first row and CP in the second row.

