Figure 2.

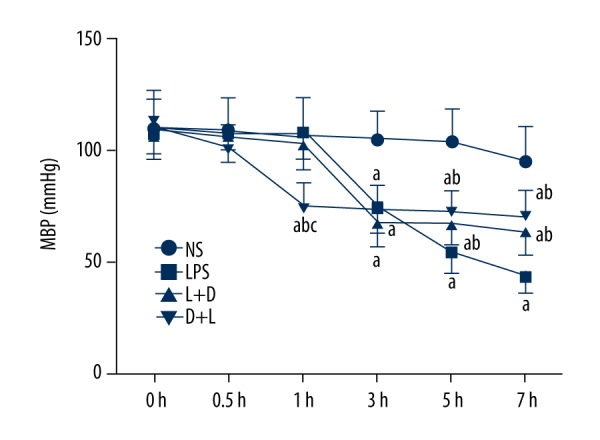
The level of MBP in rats at different time points. a. Compared with NS group (P<0.05); b. Compared with LPS group (P<0.05); c. Compared with L+D group (P<0.05).

The level of MBP in rats at different time points. a. Compared with NS group (P<0.05); b. Compared with LPS group (P<0.05); c. Compared with L+D group (P<0.05).