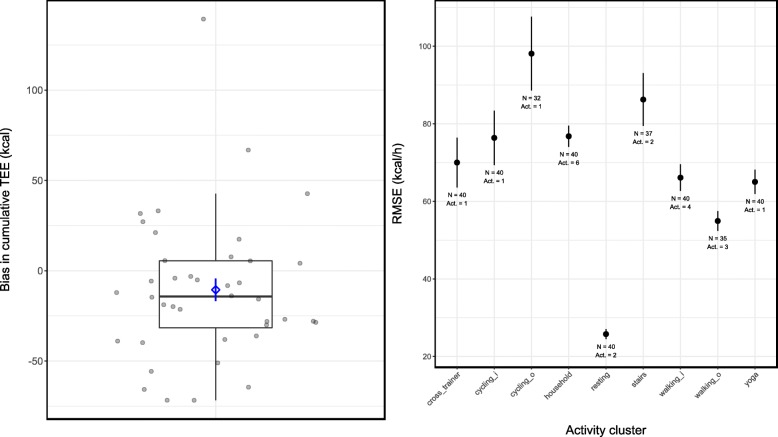
Fig. 4.
Bias in cumulative TEE, and RMSE of cumulative TEE (kcal) separately for each activity cluster. Box and whiskers plot, with participants’ individual data jittered, of the overall difference between the OHRM’s TEE estimations and the K4b2 reference measurement with the averaged bias with standard error in blue (left-hand panel), and RMSE’s for each activity cluster (with standard errors in error bars; right-hand panel). In the x-axis labels of the right-hand panel, a suffix “i” concerns indoor activities at a fixed pace on the treadmill or ergometer; the “o” suffix concerns data from outdoor activities that were self-paced. Note that the panels have different y-axis ranges. Also note that in the right-hand panel the sample size is different between activity clusters as indicated per cluster with the sample size (N) and the number of activities within each cluster (act)

