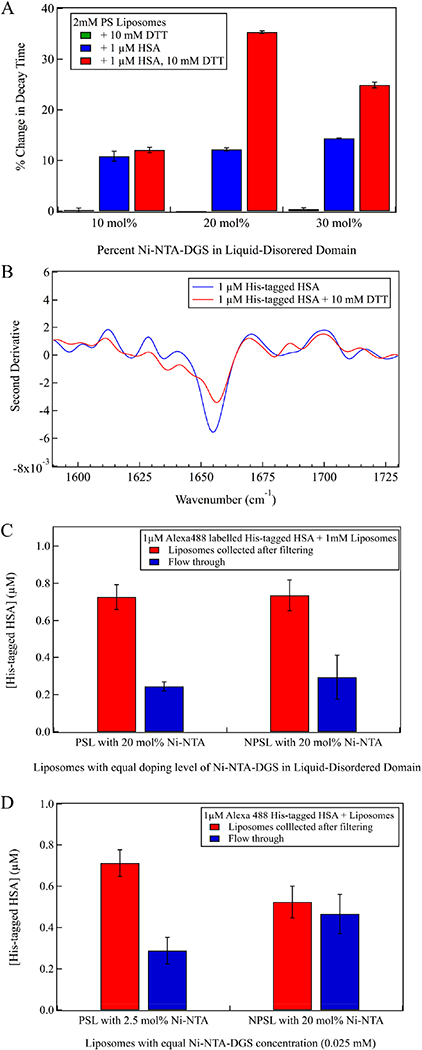
Figure 3.

(A) Percent change in autocorrelation decay time of PSL measured after protein incubation for Ni-NTA-DGS doping levels of 10-30 mol % in the liquid-disordered phase. (B) Second derivative IR spectrum of HSA (blue trace) and HSA with DTT (red trace) on phase-separated supported lipid bilayer with 30 mol % Ni-NTA-DGS. (C, D) Fluorescence assay of bound and free HSA concentrations (1 μM total [HSA]) for 1 mM PSL and NPSL liposomes with (C) equal doping levels (20 mol %) of Ni-NTA-DGS in the liquid-disordered domain and (D) equal total Ni-NTA-DGS concentrations (0.025 mM).
