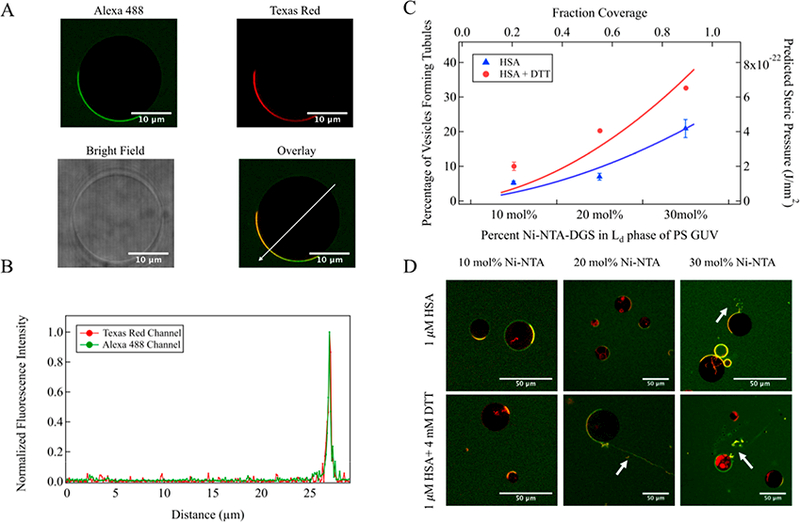
Figure 4.

GUV tabulation assay. (A) Confocal images of PSL GUV (+20 mol % Ni-NTA-DGS in fluid domain) incubated with 1 μM Alexa 488-labeled His-tagged HSA. Scale bar, 10 μm long. (B) Fluorescence intensity profile of PS GUV incubated with HSA, measured along the white arrow on the overlaid image. (C) Solid lines: theoretical prediction of steric pressure generated from lateral collisions versus fraction coverage for folded (blue trace) and unfolded (red trace) HSA on PS GUV. Symbols: qualitative measurement of percentage of GUVs forming tubules determined from confocal fluorescence images as a function of increasing percentage of Ni-NTA-DGS in the liquid-disordered phase in PS GUV. N = 3 independent experiments, >100 GUV per experiment. SD calculated from 3 independent trials. (D) Representative confocal fluorescence images of PS GUVs containing 10, 20, and 30 mol % Ni-NTA-DGS in the liquid-disordered domain after incubation with HSA (upper images) or HSA with DTT (lower images). Scale bar, 50 μm long. The green color represents Alexa 488-labeled His-tagged HSA, while the red color represents the Texas Red-doped liquid-disordered domain of GUV. The yellow color indicates overlap between the two. White arrows indicate tubules from GUV.
