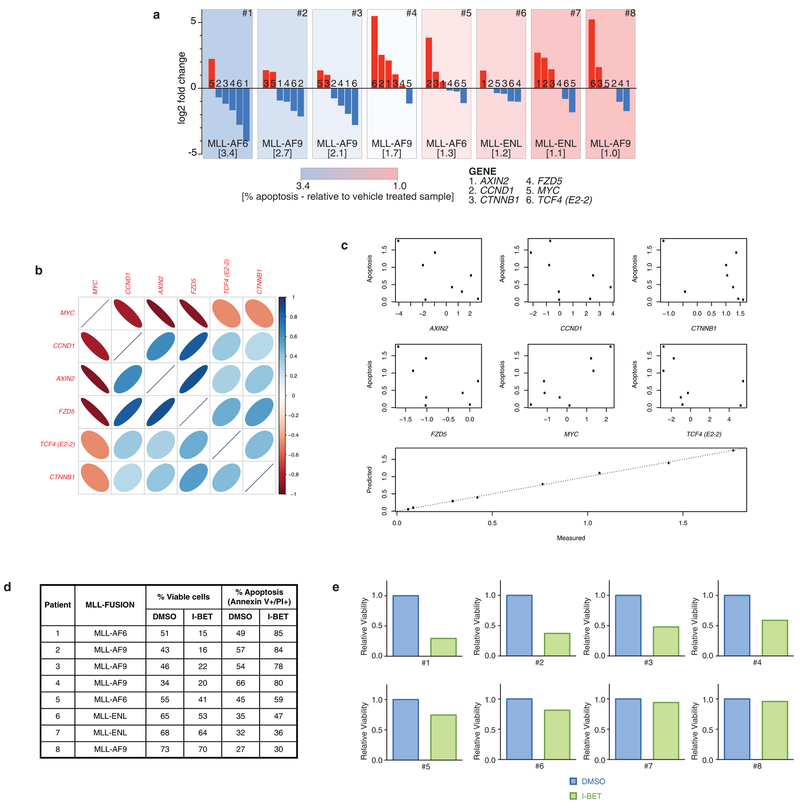
Extended Data Figure 10 |. WNT/β-catenin pathway expression correlates with responsiveness to I-BET in primary human AML samples.
a, Assessment of β-catenin pathway gene expression in eight primary human AML samples with associated response to I-BET exposure. Each panel represents an individual primary human AML sample, with genetic abnormality denoted. Waterfall plot of relative qRT–PCR expression data of key β-catenin pathway genes (AXIN2, CCND1, CTNNB1, FZD5, MYC, TCF4 (also known as E2-2)) is displayed. Each bar is labelled 1–6 according to gene represented. Relative apoptosis observed after 48 h exposure to 500 nM I-BET versus vehicle (0.1% DMSO) is denoted in square parenthesis and is also represented as a heat map background shading in each panel. b, log2-transformed expression levels of selected genes in the WNT/β-catenin pathway were measured using qRT–PCR. A corrgram shows the genes are highly correlated with each other. The colour and thinness of the ellipse indicate the strength of correlation (a line is perfect correlation; a circle is uncorrelated). The ellipse direction indicates the sign of the correlation (correlated: right/blue, inversely correlated: left/red). c, Expression of selected genes is correlated with apoptosis. Scatterplots show apoptosis versus the log2 expression level of each gene. Expression of five genes (CCND1, CTNNB1, FZD5, MYC and TCF4) predicts apoptosis. The relationship is highlighted in a plot of apoptosis predicted using a multiple linear regression model with the five genes versus the actual data. d, Apoptosis observed after 48 h exposure to either vehicle (0.1% DMSO) or 500 nM I-BET across eight primary human AML samples. e, Relative viability of primary human AML samples after treatment with I-BET.

