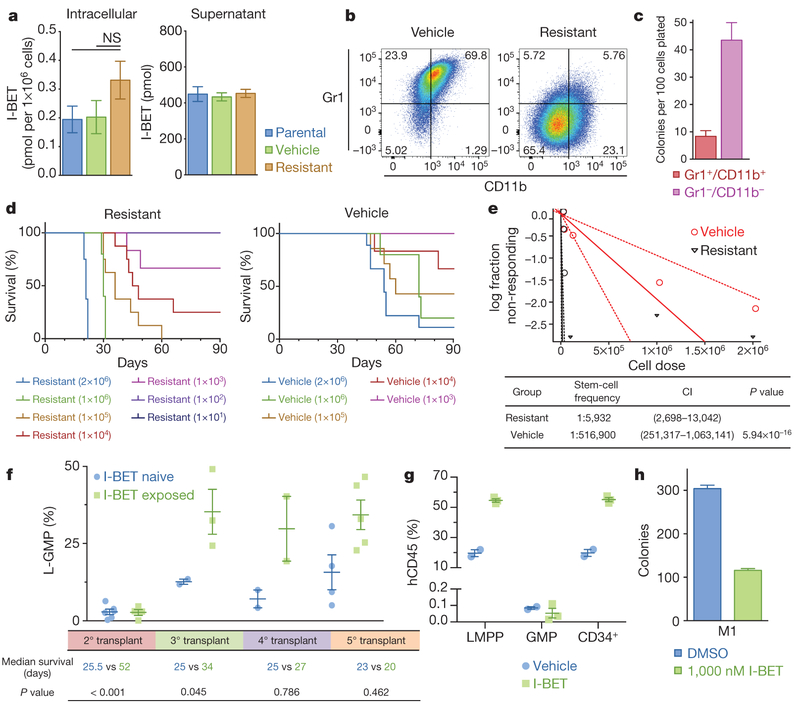
Figure 2 |. Resistance to BET inhibitors arises from the LSC compartment.
a, Intracellular and extracellular concentrations of I-BET as assessed by quantitative mass spectrometry in biological duplicates (mean ± s.e.m., statistical significance calculated using a two-tailed Student’s t-test). NS, not significant, b, Resistant clones demonstrate an immature immunophenotype (Grl−/CD11b−). c, Clonogenic capacity of the Grl−/CDllb− and Gr1+/CD11b+ populations in resistant clones performed in biological duplicate (mean ± s.e.m.). d, Limiting dilution transplantation analyses Kaplan–Meier curves of C57BL/6 mice injected with indicated number of cells detailed cohort and survival data can be found in Extended Data Fig. 3a. e, LSC frequency from limiting dilution transplantation analyses. Dotted lines indicate 95% confidence intervals (Cl), f, L-GMP frequency in whole mouse bone marrow (mean ± s.e.m.) after serial transplantation of I-BET-exposed leukaemias from in vivo resistance model. Statistical significance of survival outcomes determined using log-rank test of Kaplan–Meier survival estimates, g, Proportion of human leukaemic CD34+ cells, GMPs and LMPPs in whole mouse bone marrow (mean ± s.e.m.) after I-BET exposure in an AML PDX model (n = 5). h, I-BET-naive L-GMPs do not demonstrate intrinsic resistance to I-BET in clonogenic assays in biological duplicate experiments (mean ± s.e.m.), see also Extended Data Fig. 5b. M1, mouse 1.

