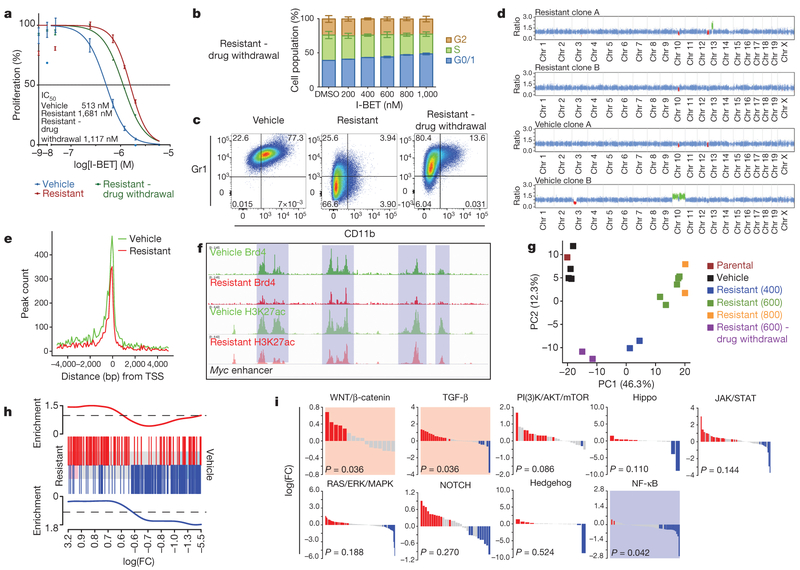
Figure 3 |. Genetic, epigenetic and transcriptional characterization of BET-inhibitor-resistant cells.
a, Proliferation assays in sensitive, resistant cells maintained in I-BET and after 8 weeks drug withdrawal (mean ± s.d., n = 12 per group). b, Cell cycle profile in resistant clones after drug withdrawal performed in biological triplicate experiments (mean ± s.e.m.). c, Immunophenotype of sensitive, resistant and drug-withdrawal cells. d, Whole-exome capture sequencing data from vehicle-treated and resistant clones normalized to the parental cell line; red regions denote copy number loss and green regions denote copy number gain. e, Brd4 binding profiled across all annotated transcriptional start sites (TSSs). f, Brd4 binding and histone 3 Lys 27 acetylation (H3K27ac) at Myc enhancer elements. g, Principle component (PC) analysis of parental cells, vehicle-treated clones (n = 4), resistant clones (n = 9) and resistant clones after drug withdrawal (n = 2). Parentheses denote concentration of I-BET (nM) in which resistant clones have been stably maintained. h, GSEA identifies enrichment of a published LSC signature in resistant clones. Upregulated and downregulated genes in the published LSC signature are shown in red and blue, respectively, and correlate with upregulated and downregulated (false discovery rate (FDR) < 5.0 × 10⁻⁵) genes in the I-BET-resistant clones. i, Statistically significant upregulation (shaded red) of the WNT/β-catenin and TGF-β pathways and downregulation (shaded blue) of the NF-κB pathway is observed in all resistant clones (n = 11).

